
 We have been experiencing increased market volatility since the S&P 500 Index peaked on September 18th with lots of big swings both up and down. We don’t worry too much about big swings to the upside, but the big swings to the downside certainly get our attention.
When the market has a string of days with the Dow Jones Average falling 200-300 points, one’s natural tendency is to worry that it will keep going until all of the money is lost. This tendency applies to the media, of course, and they begin to report about the drops, usually interviewing pundits who predict the next coming complete collapse.
So now we have experts touting bad news about a bad market, and each feeds upon the other to exacerbate our worries. We begin to wonder, “Is this time different?”
It would refreshing instead to see an interview with a realist instead of a pessimist. A realist would explain three simple truths about highly volatile days on the downside:
- Truth #1: Volatile days are necessary and are not necessarily bad. They create opportunities for you or your investment managers to buy (or re-buy) their strong holdings at more favorable prices.
- Truth #2: Volatile negative trends happen all the time, every year, even during very strong positive years. Below is a chart that I first showed you last February. The chart shows that the average intra-year drop has been 14.4%, and even strong years experienced sharply negative periods.
- Truth #3: Negative trends have always ended. They do not continue forever. They do not continue until the money is lost.
I guess the news would be a bit boring, though, if every interview about the falling market went like this: “Not to worry, this type of day is part of the process, these trends happen every year, and they always end. So just wait it out.”
Here is that chart first posted last February. It contains valuable insights into the predictability and normalcy of correction trends.
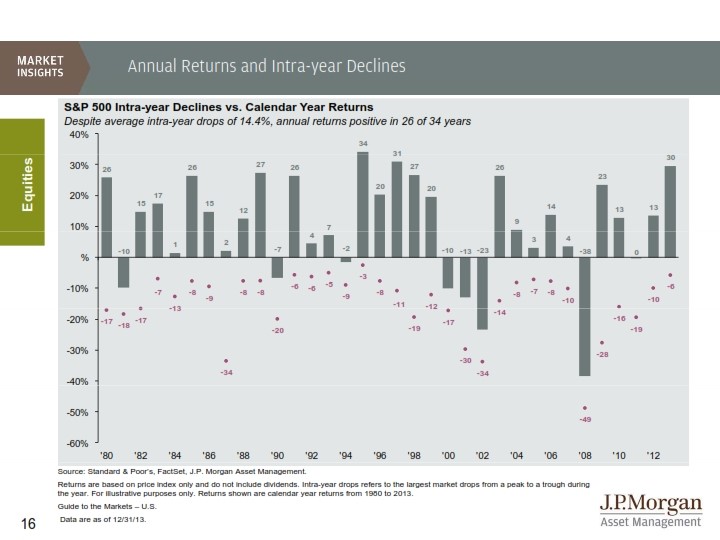
Let’s start with the sub-title of the chart. Even though the average year experiences a decline at some point of 14.4%, the market still showed positive returns 76% of the time (26 out of 34 years) since 1980. Winning 76% of the time at almost anything is pretty darn good.
No year was immune from a negative period. Negative periods just simply come with the territory.
Even really good years like 1980 (+26%), 1995 (+ 34%), 2003 (+26%) and 2013 (+30%) experienced negative intra-year declines of -17%, -3%, -14%, and -6%, respectively.
I hope this helps to understand market behavior in the days ahead.
Jeffrey
FORWARD LOOKING STATEMENT DISCLOSURE
As a Registered Investment Advisor, one of our responsibilities is to communicate with clients in an open and direct manner. Insofar as some of our opinions and comments are based on current advisor expectations, they are considered “forward-looking statements” which may or may not be accurate over the long term. While we believe we have a reasonable basis for our comments and we have confidence in our opinions, actual results may differ materially from those we anticipate. You can identify forward-looking statements by words such as “believe,” “expect,” “may,” “anticipate,” and other similar expressions when discussing prospects for particular events and/or the markets, generally. We cannot, however, assure future results and disclaim any obligation to update or alter any forward-looking statements, whether as a result of new information, future events, or otherwise. Further, information provided in this letter should not be construed as a recommendation to purchase or sell any particular security.